Having a visual representation of your data can be critical to any business. The word “dashboard” implies machine operated, and business dashboards are used in the same way. The business has hundreds of moving parts impacting overall performance. Dashboards summarize the data from these moving parts with easy-to-understand, real-time visuals. Almost any type of business can benefit from having a dashboard aligning them with their objectives. Here are three types of dashboards than can benefit any business.
1. Operational Dashboards
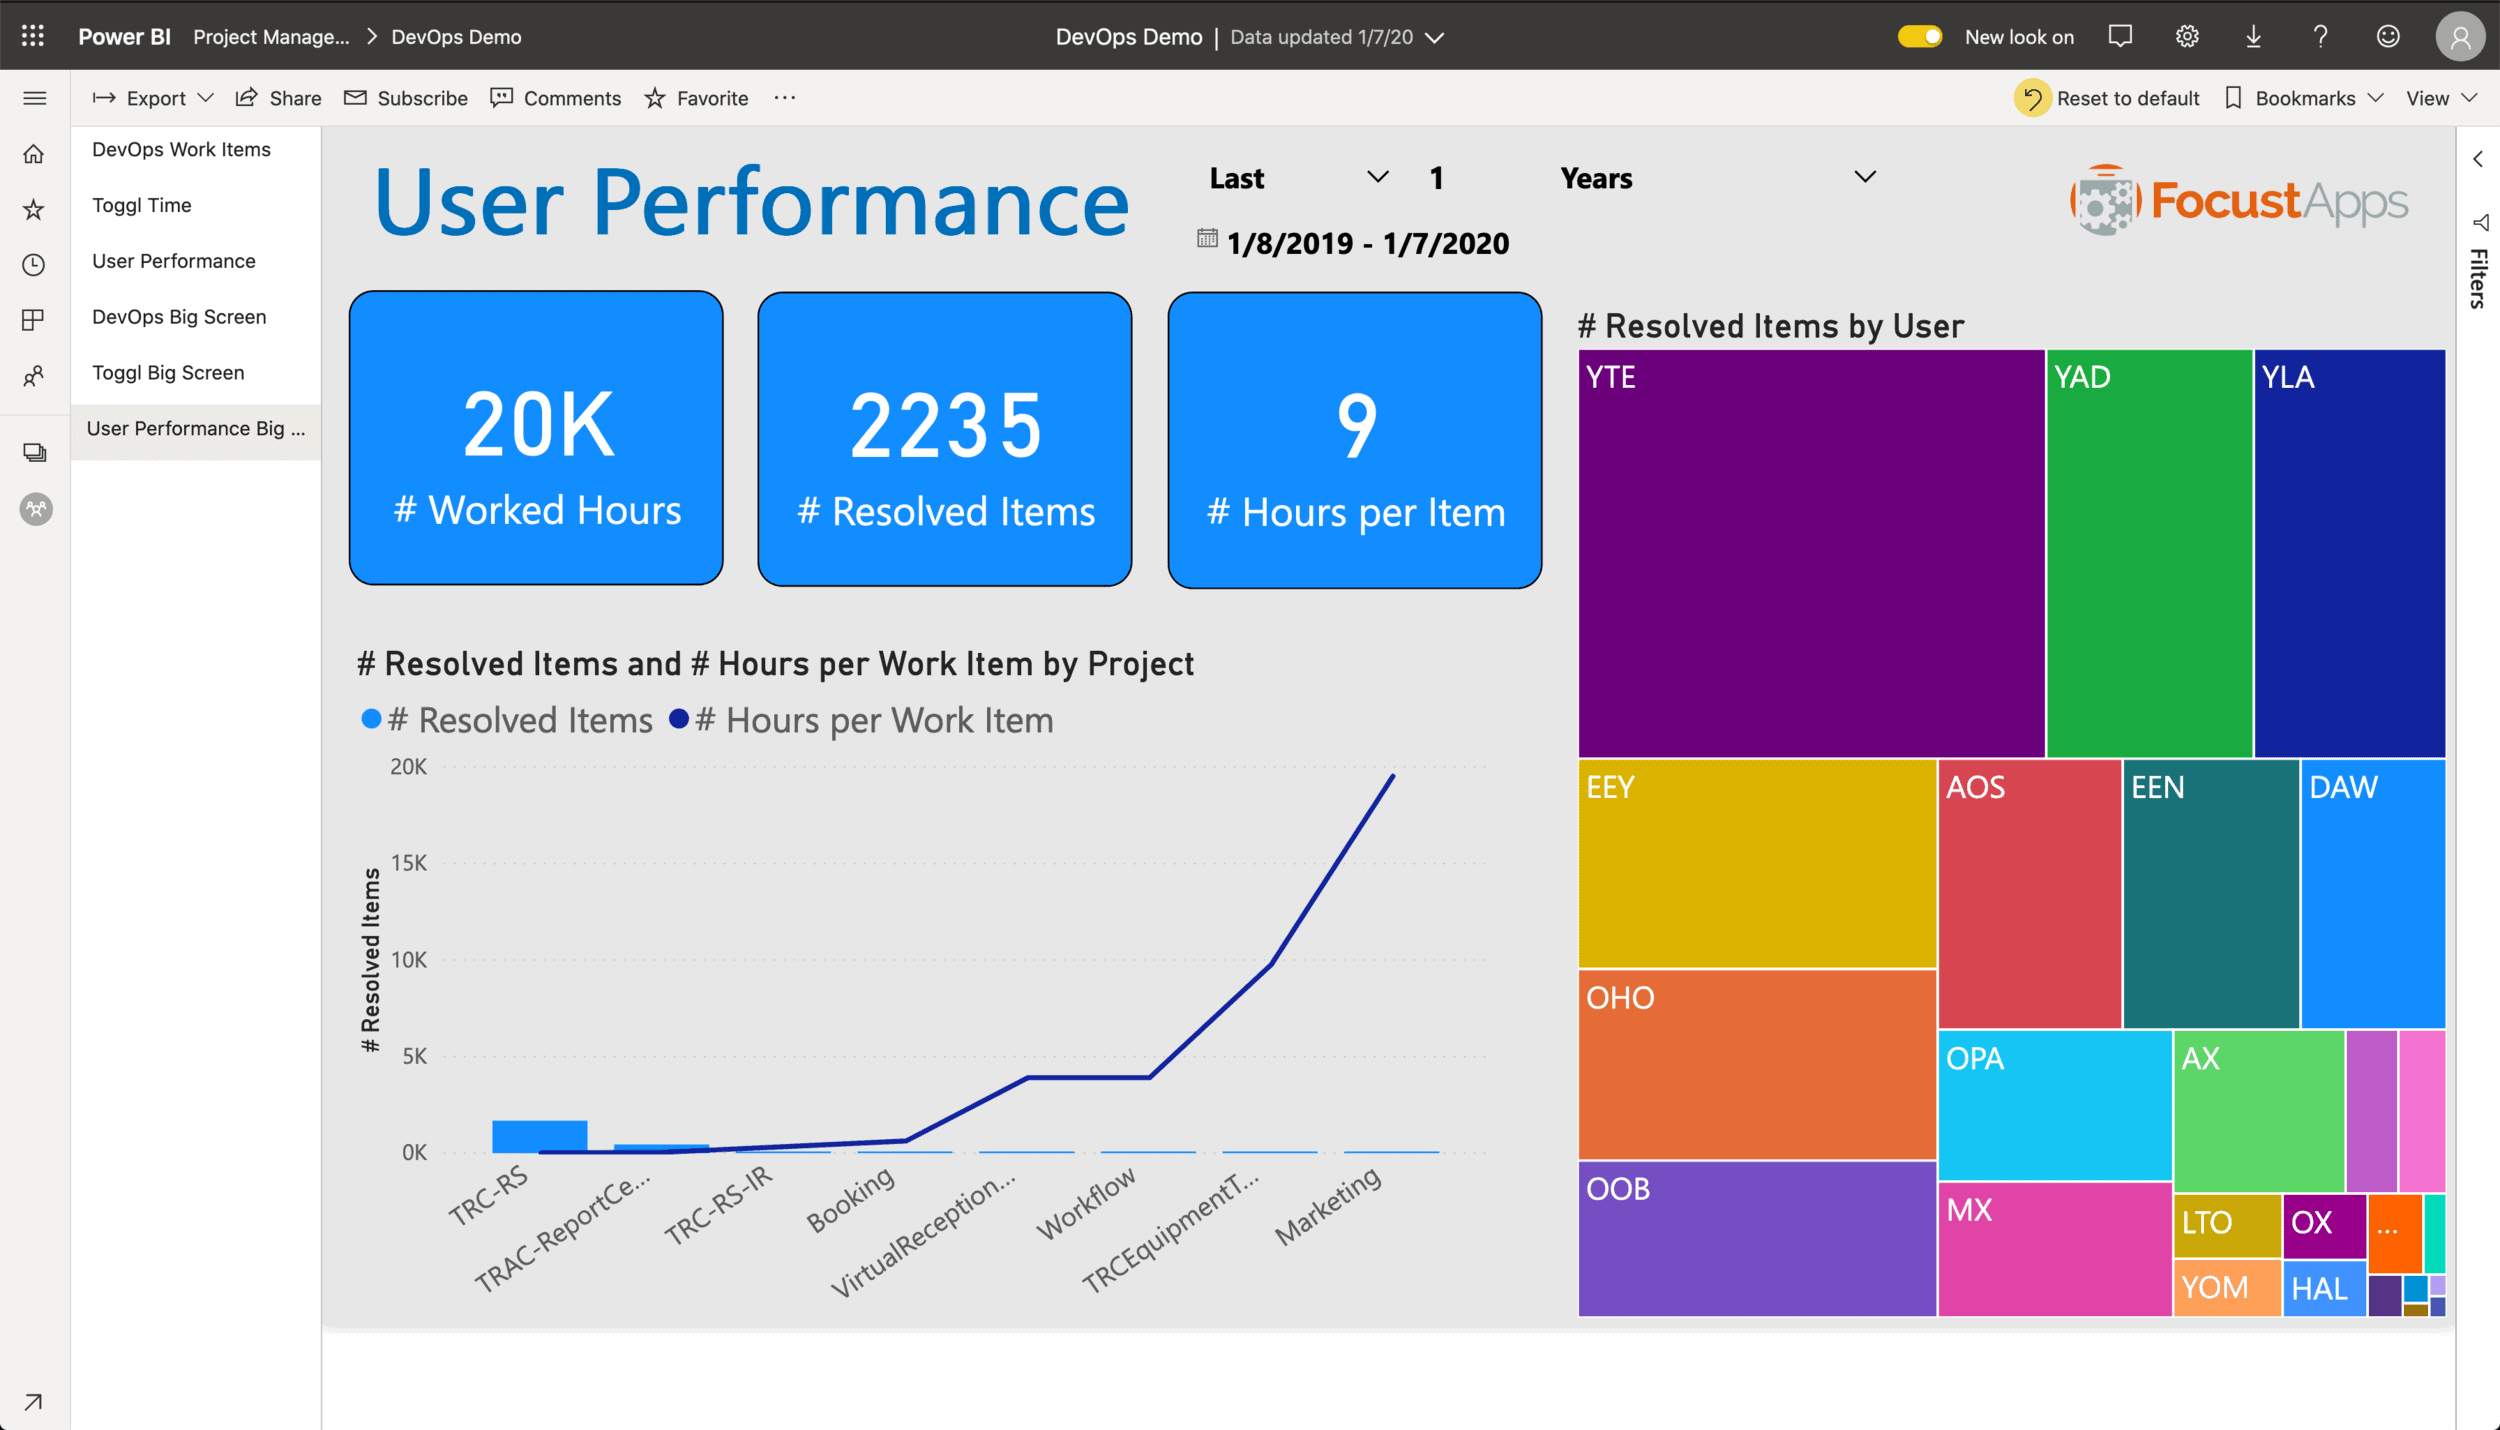
Operational dashboards are the most common type and provide a comprehensive snapshot of your business performance. Incorporating large amounts of detail without using too many drill-downs makes them ideal for monitoring and managing businesses. Metrics update in real-time and show data related to daily operations and operational teams. Departments can react with the data to make improvements, especially when they require a quick turn around since they focus on tracking processes. While monitoring and analyzing activities in specified business areas, dashboards visually and interactively point to real-time information needing addressing.
Operational dashboards are more detailed than strategic dashboards and provide operational reports with a view of specific data sets to help departments stay proactive and ahead of problems.
2. Analytical Dashboards
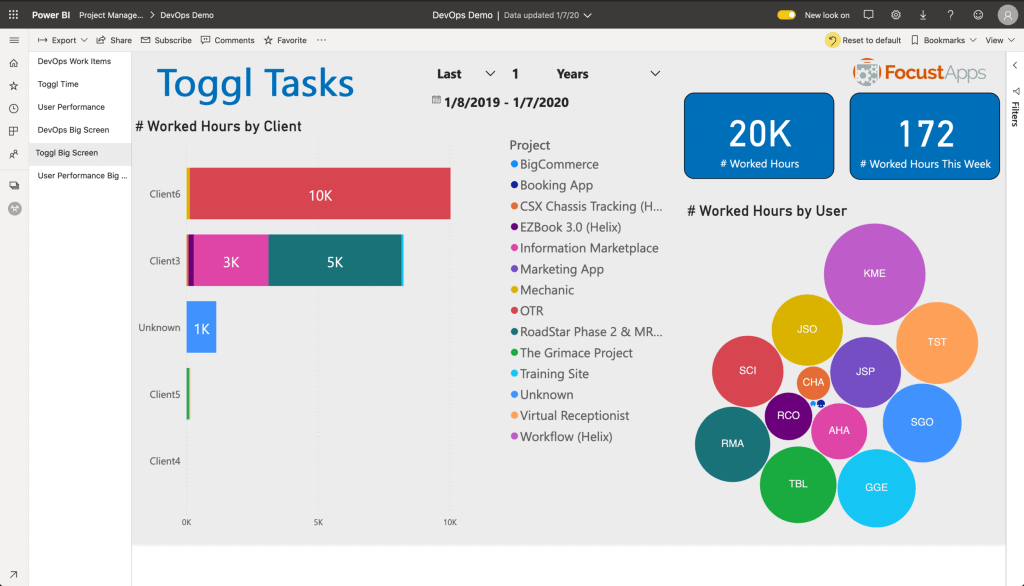
This type of dashboard uses data from the past to identify trends. Users can interact with the data on an analytical dashboard, influence future decision-making, and show analytical parallels between management and customer satisfaction. This comprehensive dashboard shows an overview of the essential aspects of a business that enable analysts to identify shifts. As an example, used in retail dashboards can show crucial metrics such as rate of return, the total volume of sales, customer retention rate, and the number of new and returning customers. They display a bigger picture of the state of the business as well as show how good the business is at developing brand loyalty. Businesses can see which aspects need to be improved, giving management the support needed for business process improvement.
3. Strategic Dashboards
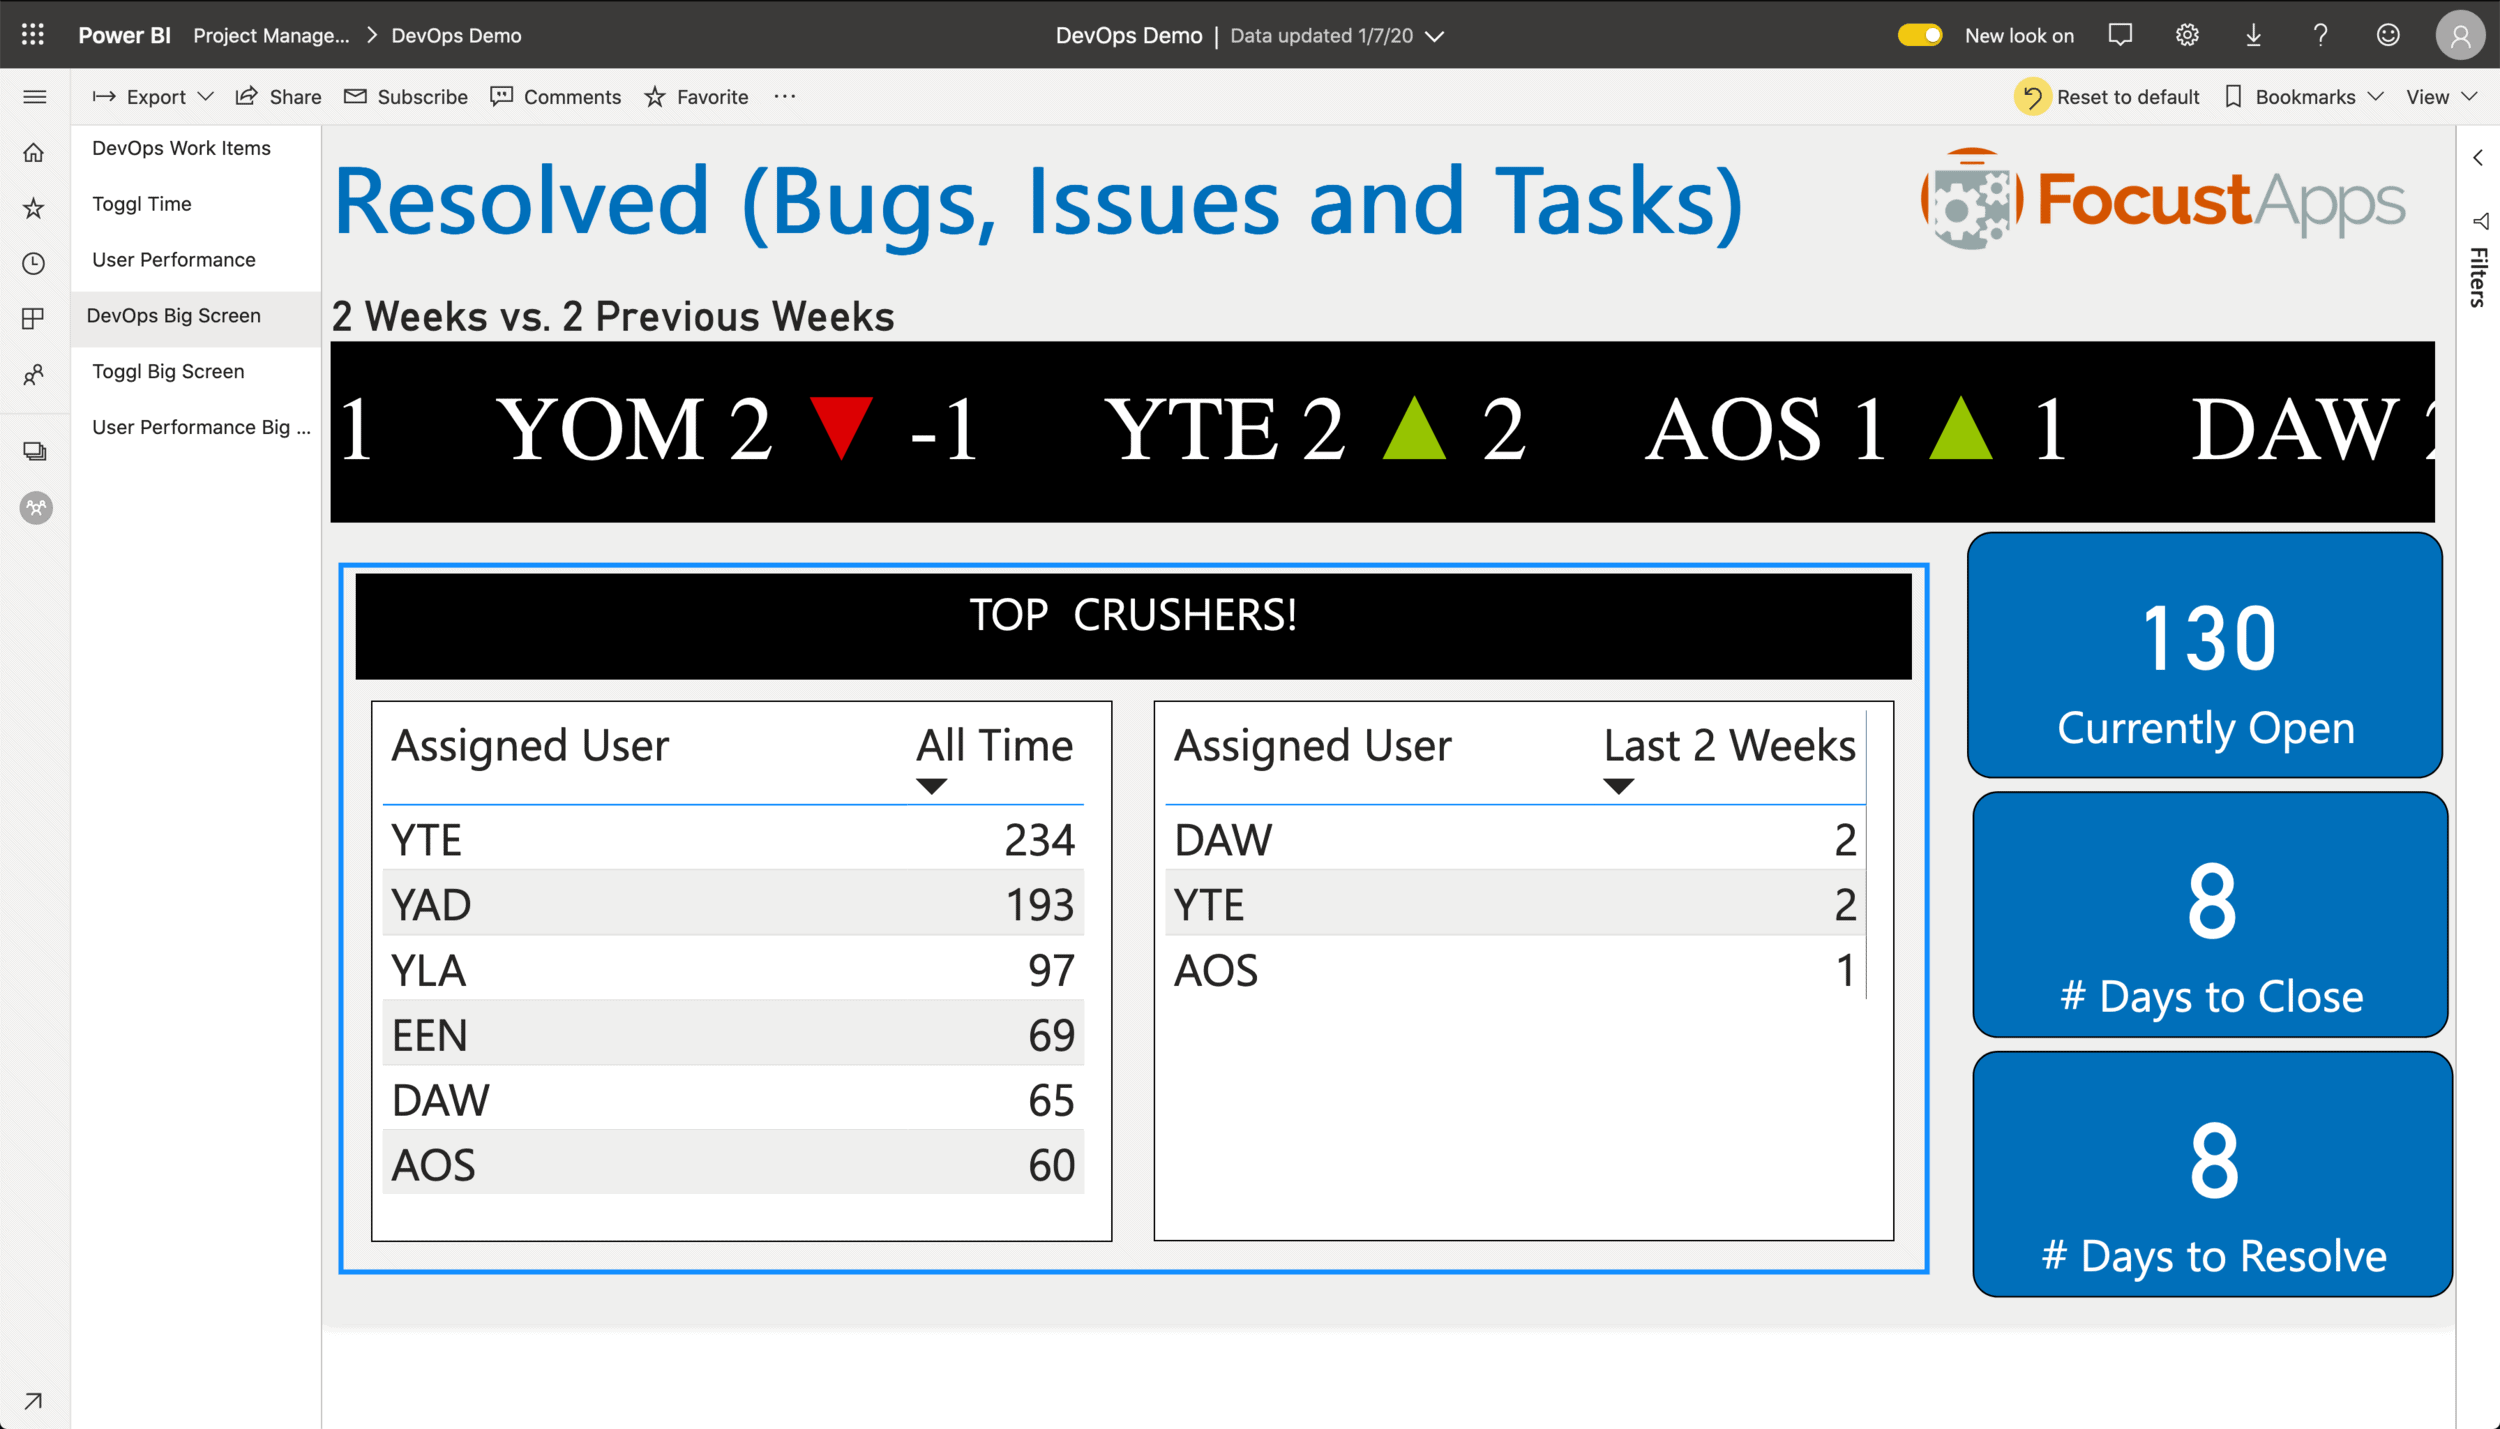
Strategic dashboards track performance concerning crucial performance indicators or KPIs. They display for businesses how to better align actions with strategy. Transparency of the data can lead to an increase in motivation and with the help of critical success factors reporting tools can monitor the long-term company strategy. Because businesses can track performance metrics against company-wide goals these types of dashboards are commonly used in a wide range of business types to align strategic goals.
The dashboard can summarize performance over set time frames such as the past month, quarter, or year. They can effectively reduce the amount of time needed to accomplish a specific business performance while reducing operational costs. Due to the ability to analyzing and display management processes, management teams have a clearer picture of opportunities to accomplish with a specific course of action. They can also use common qualitative and quantitative language to identifying a specific system.
Knowing the difference between dashboard types ensures your business is presenting the right information at the right time while using great data visualization. When creating dashboard strategies, FocustApps provides our customers with the best fit for their needs. Contact Blake Patterson at 502-907.6593 for details on how we can help your business.